
I wanna show you a super cool and easy way to reduce your cost per click (CPC – or Conversions for that matter) on your Facebook Marketing Campaigns.
This is a really clear example of how amazing the data is that you can get from digital marketing, and why its such a powerful medium.
In the example I am going to show you below, I was able to reduce my CPC by 40%. The best part of this though, is that I literally made only one change to the entire campaign, based on the data I had.
The reason that is important is, we know 100% that the one change is responsible for the results that were achieved.
So to set the scene:
In May, I posted an article about a $70,000 Facebook Ad Blueprint. I ran a campaign for a new business I had started, which was selling Dance Floors.
The initial campaign went great, I achieved $0.41 clicks to the ad page, and made a bunch of sales. I don’t have a calculated ROI, because it was so high that it doesn’t matter.
I must say that those results aren’t typical, it had more to do with the industry I was going into and the product itself.
To give you an idea though, from Facebook Ads, we generated $7,800 in sales from a $90 spend.
Pretty exciting – just goes to show the power of a marketing medium like Facebook.
Anyway, moving on…
Fast forward to July and things were looking great.
We had another shipment on its way and we were looking to scale things up, increase engagement, and really push the envelope.
So I decided to go into the Facebook Report Analytics from the first campaign I had run.
In the past, I had never really done this sort of thing, so I wasn’t looking for anything in particular…
But, best of all…
What I found completely SHOCKED me.
And perhaps it shouldn’t have.
The more I reflect on it now, it was very obvious, and only became clear because of the way I structured the initial campaign.
When I set the targeting up the first time around, I decided to leave the age bracket wide open, covering all ages from 21-65+, when in reality I knew that most dance studio owners would be older.
There was 2 reasons I did this:
- I was only really testing the idea at this point. For once, I didn’t put much research into the target audience, other than what I already knew about them. The business idea was brand new so its important in this phase to not waste time getting bogged down, and to purely see if the market would buy.[SIDE NOTE: This is a fundamental business lesson Geoff and I had to learn the hard way. Don’t waste a second “building” until your concept is proven]
- The audience for dance studio owners was pretty small anyway when I just used “interest targeting”, so I just decided to let the campaign go and worry about it later.
As I mentioned previously, the campaign still went well, and at the time I was happy with $0.41 clicks.
So now its July and I’m mining the data to see what insights I can glean.
To be honest I was just screwing around, when I stumbled across the “age” option.
Much to my excitement, this is what I found:
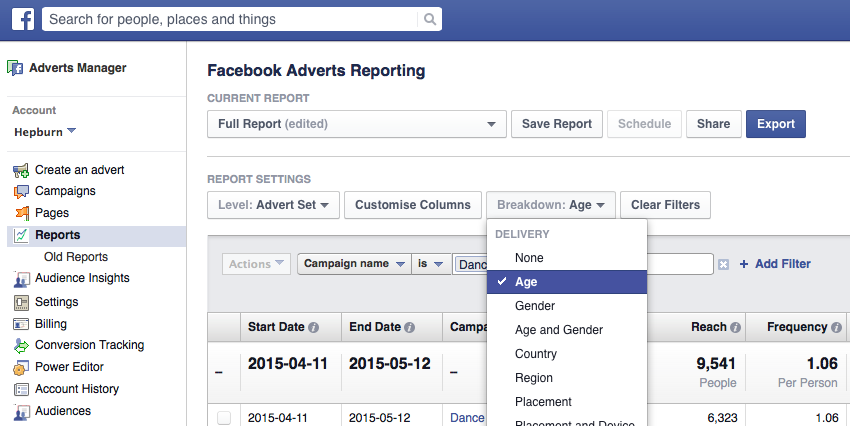
You might be wondering where this came from or what I’m talking about, so let me explain:
I went into the Ad Campaign from April, opened the Facebook Adverts Report, and selected Age as the “breakdown” metric:
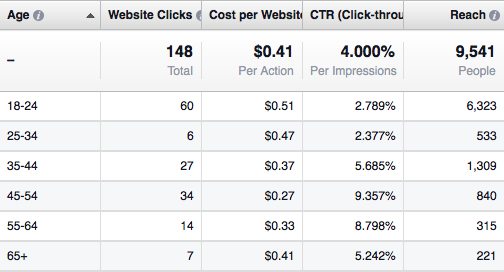
When I split the Age bracket open, take particular notice of the CTR (Click-Through-Rate). This is the percentage of your audience that clicked your ad and went through to the web page, out of those who saw it.
If you look extra close, you will see that the CTR is under 2.5% from 18 – 34, and well over 5% from 35 and up.
This is HUGE.
Straight away, I can see that the portion of my audience in the older age bracket is far more engaged with my content then the younger audience.
I have highlighted what I mean below:

As soon as I saw this I got super excited.
I knew that when I launched the new campaign, if I just targeted this audience, my engagement would go through the roof, and most importantly, my ad costs would go down.
Now at this point you may be thinking…
“That’s great… but if you are getting an insane ROI, why would you care about reducing your click costs by a small amount?”
And I agree with that.
In this instance it doesn’t make a huge difference to the overall impact of the marketing budget and sales funnel.
But in more competitive niches, making these kind of savings can be the difference between a conversion funnel that breaks even, and one that makes BANK.
Plus – why give Facebook more money than we need to right?
So with this knowledge in mind, I went out, duplicated the Campaign, set the targeting from 34-65+…. and I waited.
I have included the Ad I ran below, which you can also view here.

When the campaign ended, this is how the results looked:
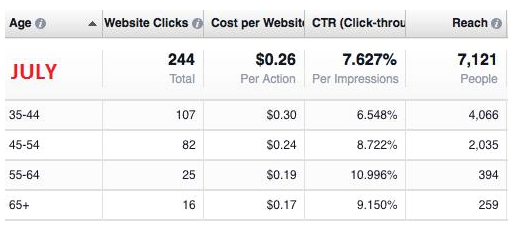
As you can see, its pretty conclusive…
The CTR was nearly double the previous campaign, the CPC was 40% less at $0.26, the audience was far more engaged, and the ads performed spectacularly well.
As the campaign only finished a week ago, I don’t have any sales results yet, so standby for an update further down the track…
But as you can see from the screenshot of the Facebook Ad Manager, the campaign was certainly a success when compared with the previous one I ran to the same audience.
CONCLUSION
So there you have it. In summary, if you want to reduce your ad costs, deep dive into the Facebook Ad Reports, as the data you have access to is completely INSANE.
Its the easiest way that I know to get more bang from your marketing buck.
That’s all for now from me.
JH